Adding Charts in Quasar using UMD (Unified Module Definition)
In this article, I will give you information to help you add charts to your SPA (Single Page Application)/Website Using Quasar UMD (Unified Module Definition).
Getting Started
Before starting on your visualization journey, you should familiarize yourself with the Quasar, Vue js.
The first thing to do is to choose only the required libraries(Installation).
The next thing to do is to import all CDN js of vue-echarts-v3 and echarts
Now you are ready to create charts. The following example explains how you can use charts in components. There are two ways you can create graphs.
Using echarts CDN
One way is that you can directly use eCharts CDN and create graphs.
The first thing to do is to add a div tag in the HTML with the id that you want and add the eCharts CDN.
The next thing to do is to get the dom element and initialize the eCharts instance using echarts.init() method and then use setOption() method to set the options. The following example explains how you can use eCharts CDN for creating graphs.
<html>
<head>
    <link href="https://fonts.googleapis.com/css?family=Roboto:100,300,400,500,700,900|Material+Icons" rel="stylesheet"
          type="text/css">
    <link href="https://fonts.googleapis.com/css?family=Open+Sans&display=swap" rel="stylesheet">
    <link href="https://use.fontawesome.com/releases/v5.0.13/css/all.css" rel="stylesheet">
    <link href="https://cdn.jsdelivr.net/npm/ionicons@^4.0.0/dist/css/ionicons.min.css" rel="stylesheet">
    <link href="https://cdn.jsdelivr.net/npm/@mdi/font@^3.0.0/css/materialdesignicons.min.css" rel="stylesheet">
    <link href="https://cdn.jsdelivr.net/npm/animate.css@^3.5.2/animate.min.css" rel="stylesheet">
    <link href="https://cdn.jsdelivr.net/npm/quasar@1.0.3/dist/quasar.min.css" rel="stylesheet" type="text/css">
    <style>
        .top-header-padding {
            padding-top: 1rem;
            padding-right: 4rem;
            padding-bottom: 3rem;
            padding-left: 4rem;
        }

        .echarts {
            height: 400px;
        }

        [v-cloak] {
            display: none;
            http: / / numeraljs . com /
        }
    </style>
</head>
<body>
<div id="q-app">
    <q-layout view="hHh Lpr lFf" v-cloak>
        <q-header>
            <q-toolbar>
                <q-toolbar-title>
                    Quasar App
                </q-toolbar-title>
                <div>Quasar v{{ $q.version }}</div>
            </q-toolbar>
        </q-header>
        <q-page-container>
            <q-page>
                <q-card class="bg-grey-2  no-border no-shadow" square>
                    <q-card-section>
                        <div class="row">
                            <div class="col-12">
                                <q-card class="bg-white no-shadow">
                                    <q-card-section>
                                        <div class="text-h6 text-grey-8 text-weight-bolder">
                                            Bar Chart
                                        </div>
                                    </q-card-section>
                                    <q-card-section class="q-pa-none q-pb-md">
                                        <div id="barChartId" class="echarts"/>
                                    </q-card-section>
                                </q-card>
                            </div>
                        </div>
                    </q-card-section>
                </q-card>
            </q-page>
        </q-page-container>
    </q-layout>
</div>
<script src="https://cdn.jsdelivr.net/npm/quasar@^1.0.3/dist/quasar.ie.polyfills.umd.min.js"></script>
<script src="https://cdn.jsdelivr.net/npm/vue@latest/dist/vue.min.js"></script>
<script src="https://cdn.jsdelivr.net/npm/quasar@^1.0.3/dist/quasar.umd.min.js"></script>
<script src="https://cdn.jsdelivr.net/npm/quasar@^1.0.3/dist/lang/pt-br.umd.min.js"></script>
<script src="https://cdnjs.cloudflare.com/ajax/libs/echarts/4.2.1/echarts.min.js"></script>
</body>
<script>
    new Vue({
        el: '#q-app',
        data: function () {
            return {
                barChartOption: {
                    grid: {
                        bottom: '25%'
                    },
                    legend: {},
                    tooltip: {},
                    dataset: {
                        dimensions: ['product', '2015', '2016', '2017'],
                        source: [
                            {product: 'Matcha Latte', '2015': 43.3, '2016': 85.8, '2017': 93.7},
                            {product: 'Milk Tea', '2015': 83.1, '2016': 73.4, '2017': 55.1},
                            {product: 'Cheese Cocoa', '2015': 86.4, '2016': 65.2, '2017': 82.5},
                            {product: 'Walnut Brownie', '2015': 72.4, '2016': 53.9, '2017': 39.1}
                        ]
                    },
                    xAxis: {
                        type: 'category',
                        axisLabel: {
                            rotate: 45
                        }
                    },
                    yAxis: {},
                    // Declare several bar series, each will be mapped
                    // to a column of dataset.source by default.
                    series: [
                        {type: 'bar'},
                        {type: 'bar'},
                        {type: 'bar'}
                    ]
                },
            }
        },
        methods: {
            CreateBarChart() {
                let bar_dom = document.getElementById('barChartId');
                let bar_chart = echarts.init(bar_dom);
                bar_chart.setOption(this.barChartOption)
            }
        },
        mounted() {
            this.CreateBarChart()
        }
    })
</script>
</html>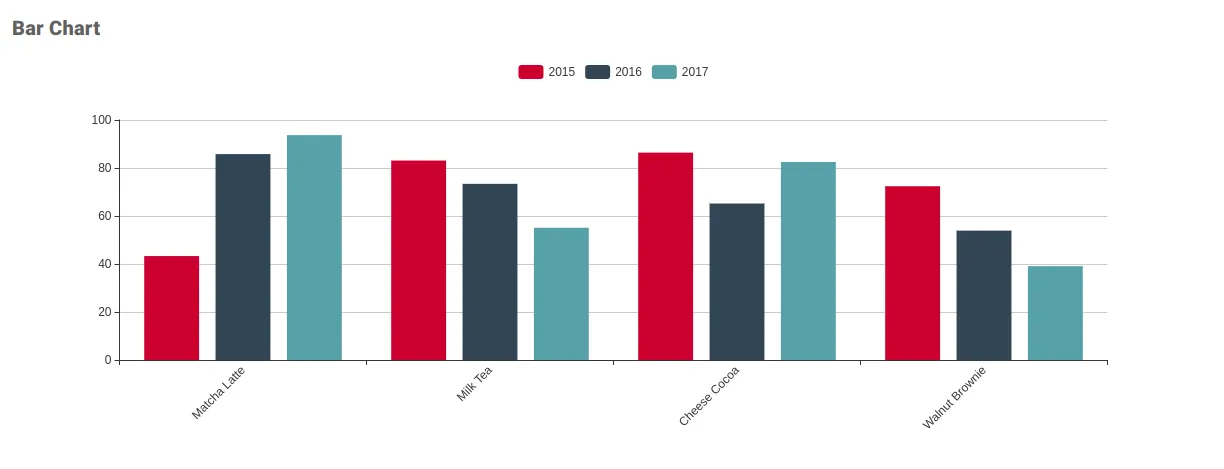
2. Using vue-echarts-v3 CDN (Component)
So, the second way is to use the vue-echarts-v3 CDN.
In my numerous attempts to integrate eCharts I ran into a lot of roadblocks. Even after adding the CDN source of vue-echarts-v3, I wasn’t able to get the eCharts component imported into my single page application. Using the “required” keyword to import eCharts followed by the “use” keyword to register it’s components did not seem to work as well.
Finally, I found the solution. While using CDN I don’t need to import anything. I get the component in VueECharts variable after which I would need to register it using components:{iecharts: VueECharts}. Now you are ready to create charts using components.
You can either use computed or just declare the options in the data section and use it the options directly.
<html>
<head>
    <link href="https://fonts.googleapis.com/css?family=Roboto:100,300,400,500,700,900|Material+Icons" rel="stylesheet"
          type="text/css">
    <link href="https://fonts.googleapis.com/css?family=Open+Sans&display=swap" rel="stylesheet">
    <link href="https://use.fontawesome.com/releases/v5.0.13/css/all.css" rel="stylesheet">
    <link href="https://cdn.jsdelivr.net/npm/ionicons@^4.0.0/dist/css/ionicons.min.css" rel="stylesheet">
    <link href="https://cdn.jsdelivr.net/npm/@mdi/font@^3.0.0/css/materialdesignicons.min.css" rel="stylesheet">
    <link href="https://cdn.jsdelivr.net/npm/animate.css@^3.5.2/animate.min.css" rel="stylesheet">
    <link href="https://cdn.jsdelivr.net/npm/quasar@^1.0.3/dist/quasar.min.css" rel="stylesheet" type="text/css">
    <script src="https://maps.googleapis.com/maps/api/js?key=AIzaSyC110C5hHuQVXreqe7Iqd7czxy6yyhD9x4" async
            defer></script>
    <style>
        .top-header-padding {
            padding-top: 1rem;
            padding-right: 4rem;
            padding-bottom: 3rem;
            padding-left: 4rem;
        }

        .echartswh {
            height: 390px !important;
        }

        [v-cloak] {
            display: none;
        }
    </style>
</head>
<body>
<div id="q-app">
    <q-layout view="hHh Lpr lFf" v-cloak>
        <q-header>
            <q-toolbar>
                <q-toolbar-title>
                    Quasar App
                </q-toolbar-title>
                <div>Quasar v{{ $q.version }}</div>
            </q-toolbar>
        </q-header>
        <q-page-container>
            <q-page>
                <q-card class="bg-grey-2  no-border no-shadow" square>
                    <q-card-section>
                        <div class="row">
                            <div class="col-6">
                                <q-card class="bg-white no-shadow">
                                    <q-card-section>
                                        <div class="text-h6 text-grey-8 text-weight-bolder">
                                            Pie Chart
                                        </div>
                                    </q-card-section>
                                    <q-card-section class="q-pa-none q-pb-md">
                                        <iecharts :option="pieChartOption" class="echartswh"
                                                  :resizable="true"></iecharts>
                                    </q-card-section>
                                </q-card>
                            </div>
                            <div class="col-6">
                                <q-card class="bg-white q-ml-sm no-shadow">
                                    <q-card-section>
                                        <div class="text-h6 text-grey-8 text-weight-bolder">
                                            Line Chart
                                        </div>
                                    </q-card-section>
                                    <q-card-section class="q-pa-none q-pb-md">
                                        <IEcharts :option="GetLineChartOption" :resizable="true" class="echartswh"/>
                                    </q-card-section>
                                </q-card>
                            </div>
                        </div>
                    </q-card-section>
                </q-card>
            </q-page>
        </q-page-container>
    </q-layout>
</div>
<script src="https://cdn.jsdelivr.net/npm/quasar@^1.0.3/dist/quasar.ie.polyfills.umd.min.js"></script>
<script src="https://cdn.jsdelivr.net/npm/vue@latest/dist/vue.min.js"></script>
<script src="https://cdnjs.cloudflare.com/ajax/libs/numeral.js/2.0.6/numeral.min.js"></script>
<script src="https://cdn.jsdelivr.net/npm/quasar@^1.0.3/dist/quasar.umd.min.js"></script>
<script src="https://cdn.jsdelivr.net/npm/quasar@^1.0.3/dist/lang/pt-br.umd.min.js"></script>
<script src="https://cdn.jsdelivr.net/npm/quasar@^1.0.3/dist/icon-set/fontawesome-v5.umd.min.js"></script>
<script src="https://cdnjs.cloudflare.com/ajax/libs/echarts/4.2.1/echarts.min.js"></script>
<script src="https://cdn.jsdelivr.net/npm/vue-echarts-v3/dist/VueECharts.min.js"></script>
<script src="https://requirejs.org/docs/release/2.3.5/minified/require.js"></script>
</body>
<script>
    new Vue({
        el: '#q-app',
        components: {iecharts: VueECharts},
        computed: {
            pieChartOption() {
                return {
                    title: {
                        text: 'Product Pie Chart',
                        x: 'center'
                    },
                    tooltip: {
                        trigger: 'item',
                        formatter: "{a} <br/>{b} : {c} ({d}%)"
                    },
                    legend: {
                        orient: 'vertical',
                        left: 'right',
                        data: ['Prod1', 'Prod 2', 'Prod 3', 'Prod 4', 'Prod 5']
                    },
                    series: [
                        {
                            name: 'Products',
                            type: 'pie',
                            radius: '55%',
                            center: ['50%', '50%'],
                            data: [
                                {value: 335, name: 'Prod 1'},
                                {value: 310, name: 'Prod 2'},
                                {value: 234, name: 'Prod 3'},
                                {value: 135, name: 'Prod 4'},
                                {value: 1548, name: 'Prod 5'}
                            ],
                            itemStyle: {
                                emphasis: {
                                    shadowBlur: 10,
                                    shadowOffsetX: 0,
                                    shadowColor: 'rgba(0, 0, 0, 0.5)'
                                }
                            }
                        }
                    ]
                }
            },
            GetLineChartOption() {
                return {
                    xAxis: {
                        type: 'category',
                        data: ['Mon', 'Tue', 'Wed', 'Thu', 'Fri', 'Sat', 'Sun']
                    },
                    yAxis: {
                        type: 'value'
                    },
                    series: [{
                        data: [820, 932, 901, 934, 1290, 1330, 1320],
                        type: 'line'
                    }]
                }
            }
        }
    })
</script>
<style>
</style>
</html>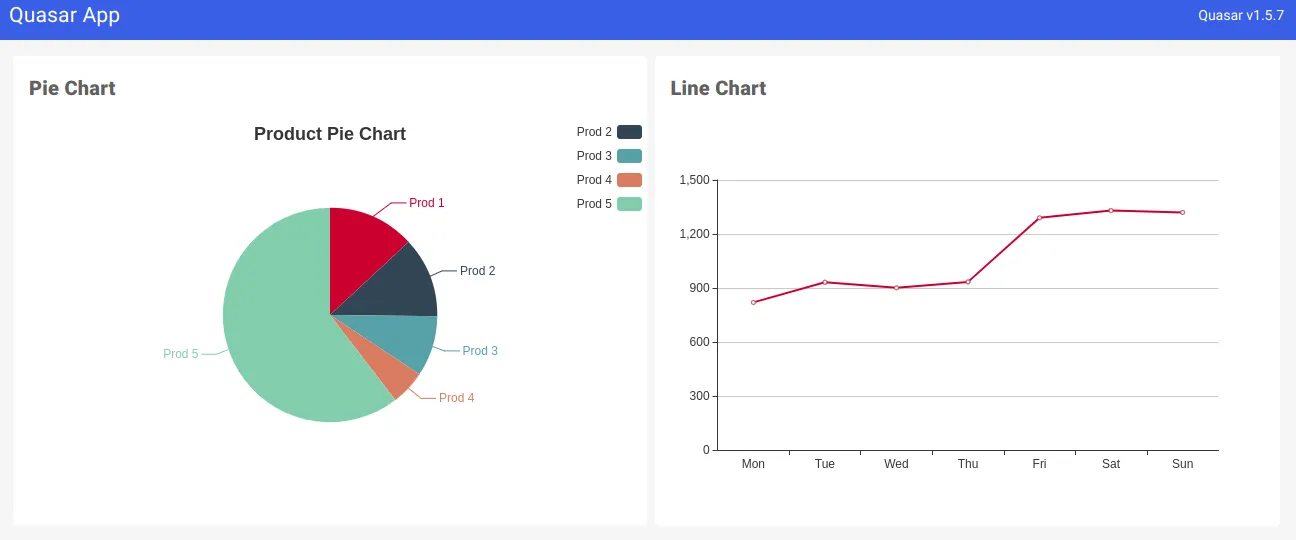
Accessing Chart Documentation
ECharts provides many more types of charts besides the bar and line chart. eCharts provides various options that you can add to your chart. If you want to find out about the other chart types and options that are available you can read their documentation.
Conclusion
It is very easy to add custom charts and graphs to your Quasar SPA (Single Page Application/Website) using eCharts CDN.
Thanks for reading.